Can LLMs Eyeball Your Spreadsheet?
People have often claimed that LLMs will let you “talk to your data.” But if you try that, what will it tell you? Paste a CSV into a chatbot and ask “what’s the average salary here?” and you’ll get a confident, well-formatted answer. But is it correct?
If you know anything about LLMs you wouldn’t expect them to be able to handle data questions natively (remember when frontier models like GPT-4o and Claude were famously insisting that there are only two r’s in “strawberry”?). But today’s models are heavy on the tool use, and they’re great at writing Python code to answer statistical questions exactly.
But sometimes when you ask Claude a question about your data it doesn’t use a tool. In those cases, can you trust its output?
We ran a small benchmark to find out. We gave the models a table of employee records and asked them basic statistical questions — counts, means, medians, percentages, outliers, correlations. To see the difference with tool use, we had each model answer every question under two different conditions:
- No tools: the CSV is pasted directly into the prompt, and the model has to “eyeball” the math in its head.
- With tools: the same prompt, but the model gets a single tool,
run_python(code), executed against the same data (preloaded as a pandas DataFrame).
The prompts are otherwise identical, and we grade their responses deterministically against ground truth computed with pandas. We allow a small tolerance (typically ±1%) for floating point answers but counts and names must be exact. We’d expect performance to degrade as the size of the dataset increases, so we test the models on datasets of increasing size.
The data and the questions
The datasets are synthetic employee tables at three sizes — 50, 250, and 1,000 rows — with columns for department, age, salary, city, hire date, and remote status. The structure is set up so every question has an unambiguous answer.
When pasted into a prompt, the three sizes work out to roughly 1.5k, 7k, and 28k tokens of CSV so they fit well within the models’ context windows.
For each size of table, we ask the model the same 14 questions:
| # | Question | Category | Answer (250-row table) |
|---|---|---|---|
| 1 | How many employees are in the dataset? | count | 250 |
| 2 | How many employees are in the Sales department? | count | 53 |
| 3 | How many employees are older than 40 and based in Chicago? | count | 30 |
| 4 | What is the mean salary across all employees? | central | $116,814.81 |
| 5 | What is the median salary across all employees? | central | $112,531 |
| 6 | What is the mean salary in the Engineering department? | central | $134,097.78 |
| 7 | What is the mean age of all employees? | central | 42.8 |
| 8 | What is the highest salary in the dataset? | extremes | $289,159 |
| 9 | What is the name of the employee with the highest salary? | extremes | Xena Hoffman |
| 10 | What is the name of the employee who was hired earliest? | extremes | Zane Ito |
| 11 | What percentage of employees are remote? | share | 32.4% |
| 12 | Which department has the highest mean salary? | group | Engineering |
| 13 | Which employee ids have a salary more than 3 standard deviations from the mean? | outliers | [156, 191, 241] |
| 14 | Is the correlation between age and salary positive, negative, or approximately zero? | correlation | positive |
We used DeepInfra for these tests and tried a number of open-weights models (DeepSeek-V3, Kimi K2.6, GLM-5/5.1/5.2, Qwen3.5-35B) as well as Anthropic’s Claude Sonnet 5 and Claude Opus 4.8. We also tested MiniMax-M2.5 but excluded it from the results because its endpoint was unstable during our runs — identical runs hours apart produced wildly different scores. We ran all the tests through LiteLLM at temperature 0.
The main result: LLMs need tools
With the Python tool, every model scored 100%. All eight, at every dataset size. As you might expect, every model can write simple Python code. So all of the interesting benchmarks are without tool use.
With no tools, accuracy ranged from 55% to 88% — and the no-tools runs burned an average of ~5,500 completion tokens grinding through mental arithmetic (versus ~140 with the tool), taking 10× longer per question. Slower, more expensive, and wrong a third of the time.
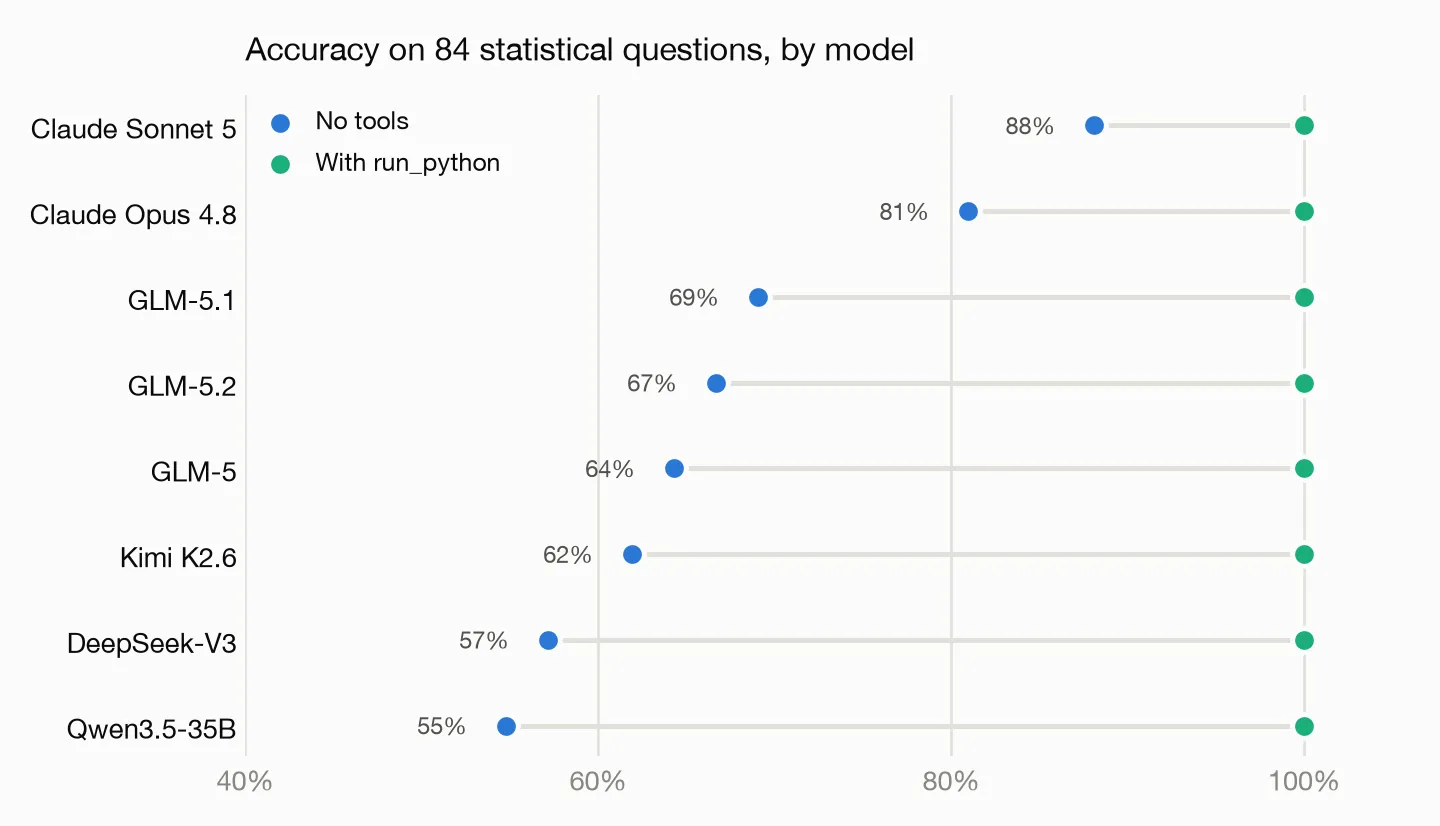
Two things stand out. First, the frontier models are meaningfully better at mental math: the two Claude models sit at 81–88% while the open-weights pack clusters at 55–69%. Second — and more important — that entire gap evaporates the moment anyone gets a Python interpreter. Tool use is the great equalizer: a 35B open model with run_python matches or beats a frontier model without it, on every question, at every size.
The bigger the table, the worse the response
As you’d expect, the models (without tools) get worse as the dataset gets bigger. The plots below show the average performance of each model across each of the 14 questions.
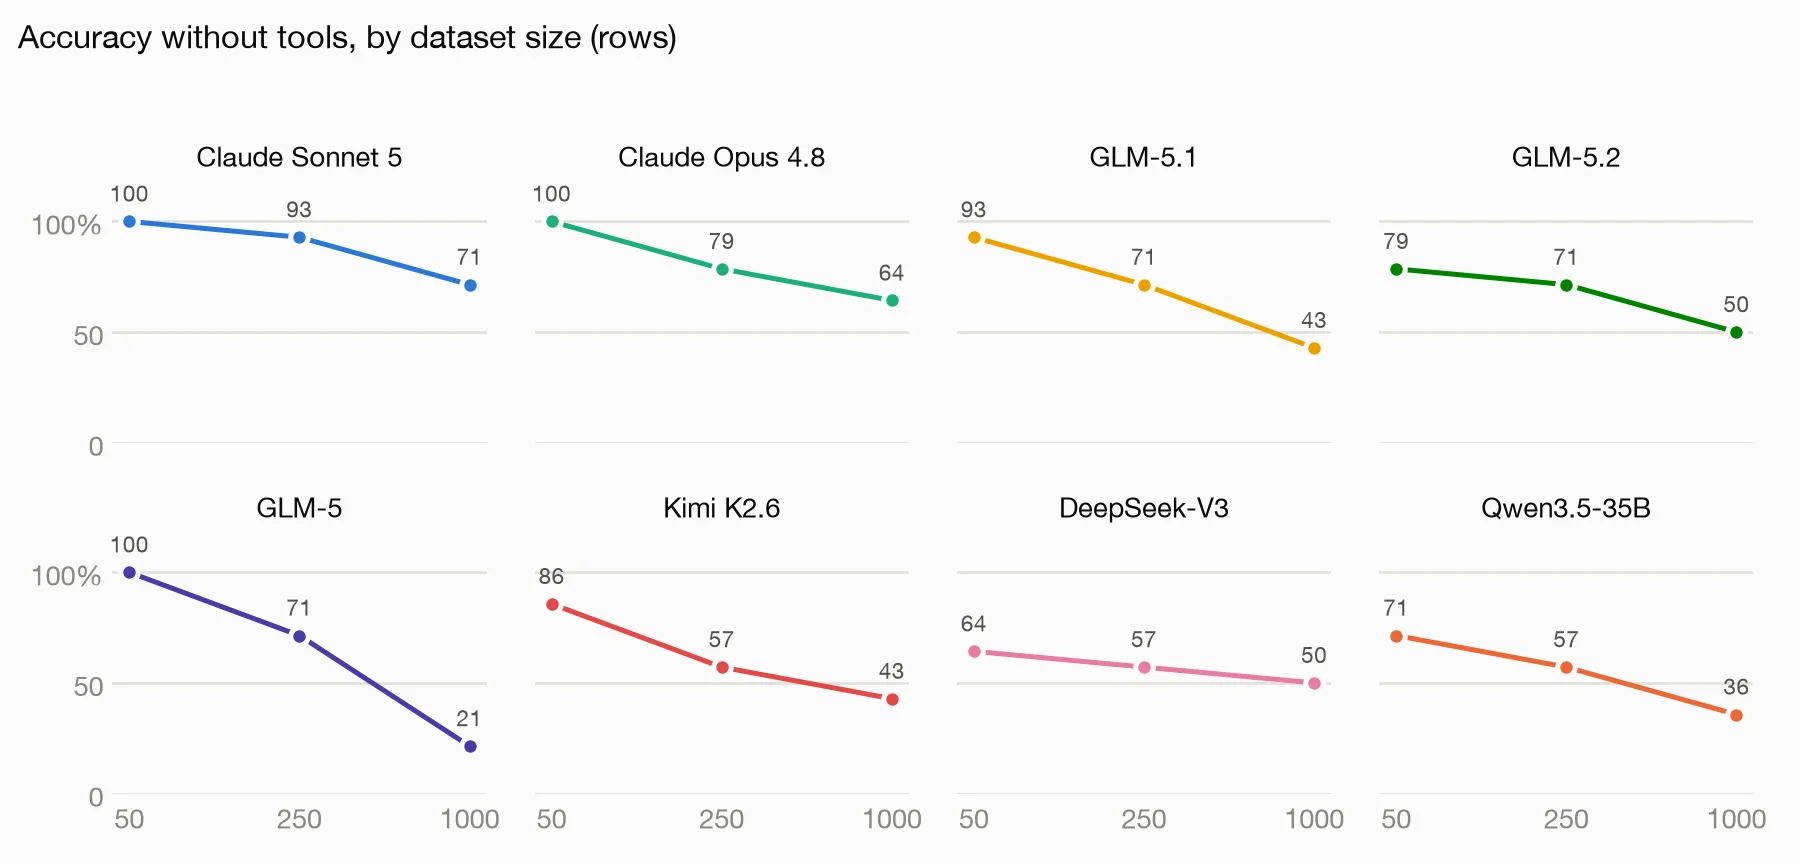
At 50 rows, most models can genuinely do the arithmetic — three of the eight score a perfect 14/14. At 250 rows the open-weights pack drops to 57–71% while Sonnet holds 93%. At 1,000 rows everything sags: the best model (Sonnet 5) manages 71%, and GLM-5 collapses to 21%. Averaged across models, no-tools accuracy falls from 87% → 69% → 47% as the table grows from 50 to 1,000 rows.
Remember, the 1,000-row table is only ~28k tokens, so the failure isn’t context length. Summing a thousand numbers in your head doesn’t work, whether you’re a human or a transformer.
Diving into a few specific questions
The plots above show the aggregate success of each model (aggregated across the 14 questions). But it’s worth looking at a few questions in particular to get a feeling for how the models behave.
The correlation question
“Is the correlation between age and salary positive, negative, or approximately zero?”
This one needs no arithmetic precision at all. The correct response is one word, and there are only three choices. We built the data so that it has a built-in positive trend, so the answer should be fairly clear. Here’s the actual 50-row table the models saw:
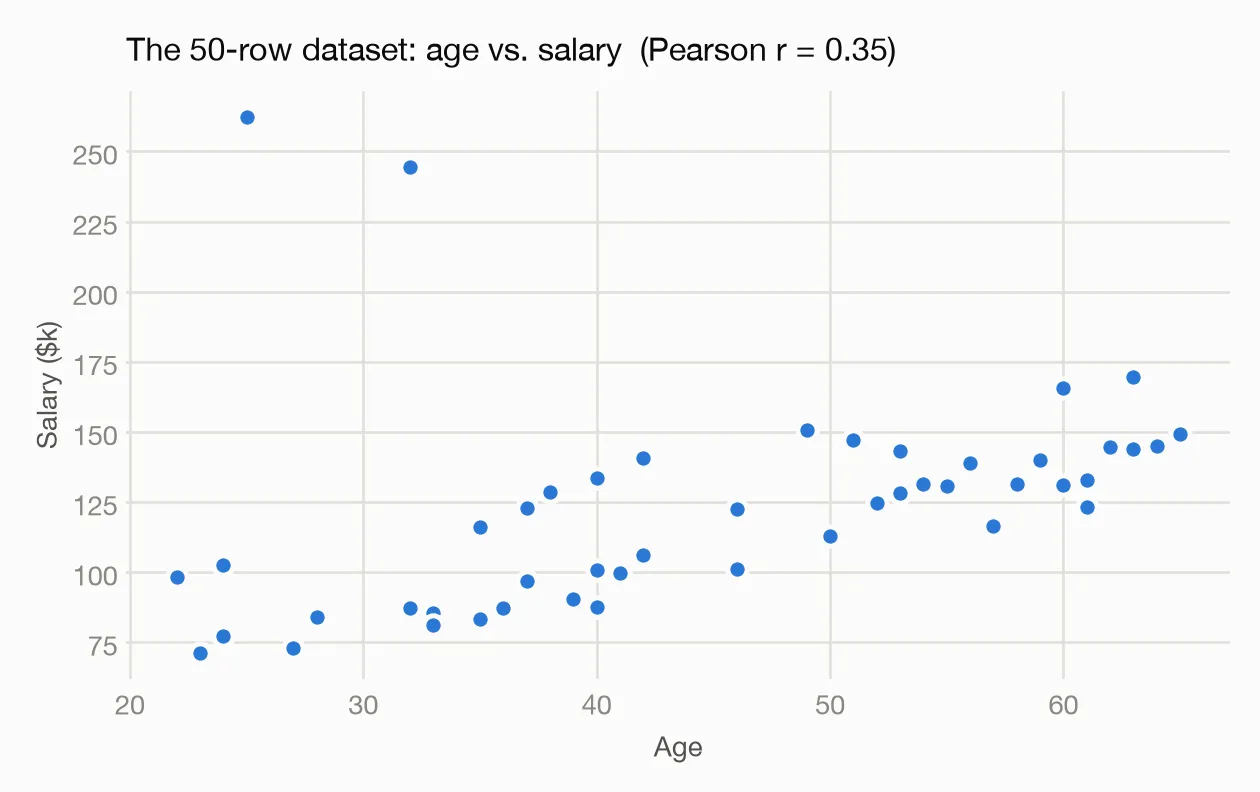
A human glancing at this scatter says “positive” without hesitation. But half the models got it wrong at 50 rows — only Claude Opus, Claude Sonnet, DeepSeek-V3, and GLM-5 answered correctly.
The trap is those two outliers in the upper left. The dataset’s injected salary outliers happen to be young employees, and at 50 rows two outliers carry a lot of weight: they drag the Pearson correlation from 0.82 (without them) down to 0.35 (with them). It’s possible that the models saw a young person making $262k and concluded that the correlation was not there.
One reason to think that this was a case of the outliers tricking the models is that this is also the one question where more data helped instead of hurt. As the table grows, the outliers get diluted and the correlation strengthens (r = 0.35 → 0.67 → 0.81), and accuracy climbs right along with it: 4/8 correct at 50 rows, 6/8 at 250, 7/8 at 1,000. Every other question got harder with scale but this one got easier. The models aren’t actually computing correlations, they’re just looking for vibes — and the vibes improve with sample size.
The outlier hunt
“Which employee ids have a salary more than 3 standard deviations from the mean? (Use the sample standard deviation.)”
If you do try to answer this question correctly, this could be the hardest question in the set, because it requires a multi-step computation. First, you compute the mean, then you compute the sample standard deviation, then you derive the threshold, then scan every row against it — and name all the outliers with no false positives.
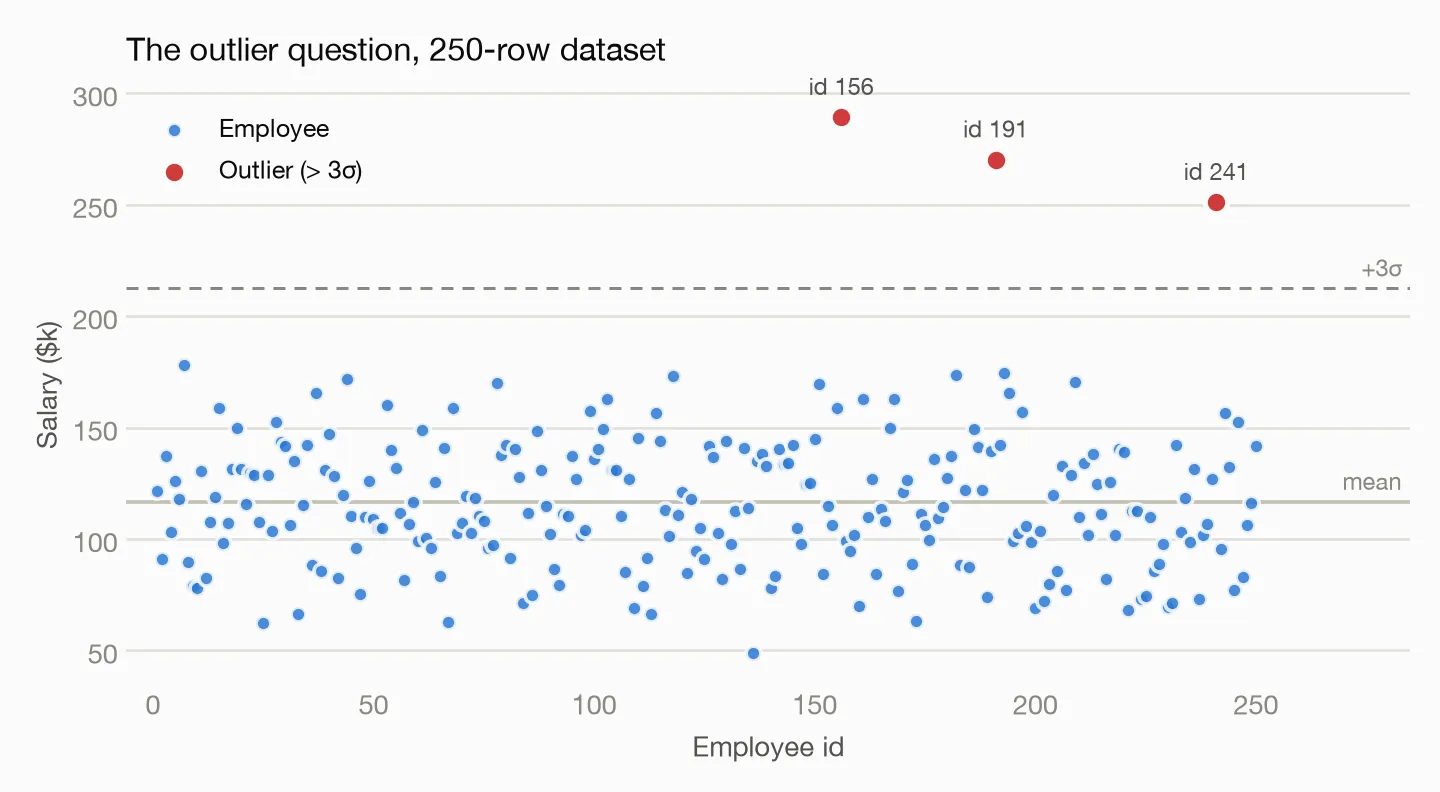
But in this case, a human (without access to pandas) would probably just eyeball the answer. There are exactly three outliers, and they’re way more than three standard deviations from the mean. With run_python, every model nails it. Without tools, the models do terribly: 6/8 correct at 50 rows, then 3/8 at 250 (only the two Claude models and DeepSeek-V3), then 2/8 at 1,000 — just Claude Opus and Claude Sonnet. Estimating a standard deviation over a thousand values in your head, then doing an exact threshold scan, is exactly the kind of work language models should never be doing unassisted.
You still might expect the models to just pick out the outliers without calculating the standard deviations. But apparently they can’t even do that.
Counting
Counting is not a hard question, but it’s the one most people have seen the models flub (e.g., How many ‘R’s in Strawberry?). Models are actually a lot better now, and they can count better than I expected. We asked the models “How many employees are in the Sales department?”. This is a pure counting task, just a scaled-up version of how many R’s in Strawberry. At 50 rows (the answer is 10), seven of eight models counted correctly — only DeepSeek-V3 missed. At 250 rows (the answer is 53), six of eight still got it right. But at 1,000 rows (the answer is 243), six of eight models miscounted — only Claude Sonnet 5 and Qwen3.5-35B survived. Notably, Qwen3.5-35B — the smallest model in the lineup — out-counted Claude Opus 4.8 here, a reminder that the frontier advantage in mental math is real on average but not reliable on any given question.
The takeaway
If an LLM answers a quantitative question about your data and it didn’t run code to do it, treat the answer as a guess. It’s a surprisingly good guess at 50 rows, but pretty bad at 1,000. The frontier models are better than the open-weights models, but their failure rate is still high enough that it’s not safe to trust them.
The practical rule: never make the model do the arithmetic. Make it write the arithmetic.